TenthMatrix technical brief: how to uncover LLM and multi-agent bottlenecks with OpenTelemetry, Prometheus/Grafana/Thanos, and LLM platforms such as Langfuse / LMNR — including span schemas, cost attribution, sampling, and hard usage caps. Companion: business blog · serving: Turbocharging LLMs · lab: Enterprise AI Lab.
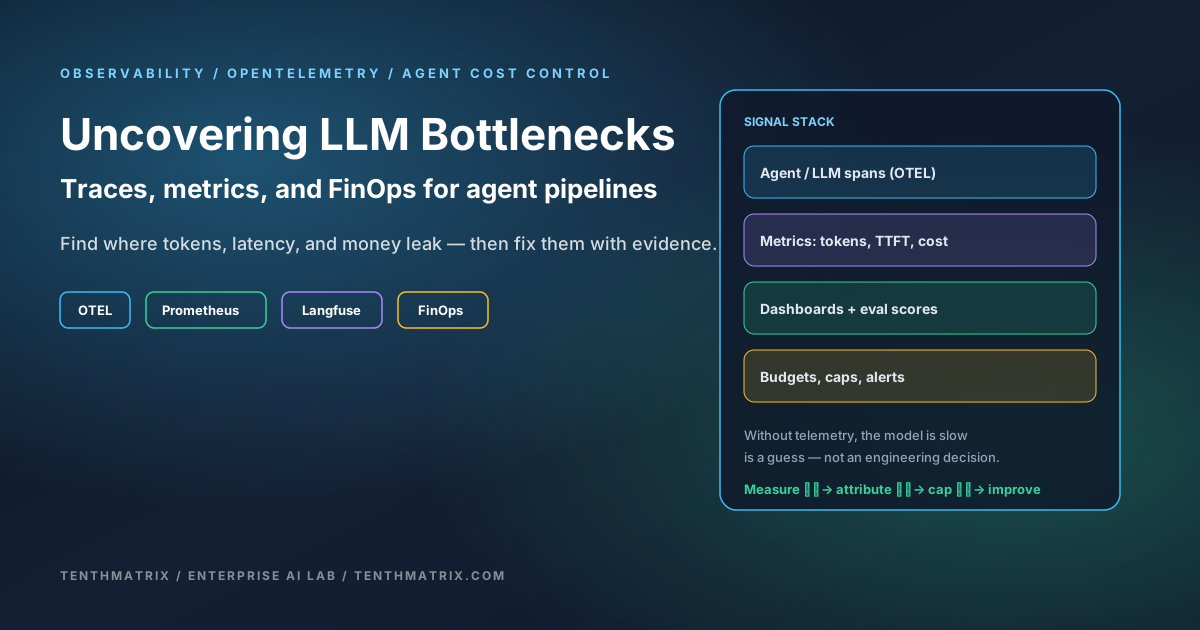
- Problem: Agent cost and latency hide in hops (LLM → tools → RAG → retries), not in a single “model is slow” metric.
- Standard: Instrument with OpenTelemetry; one attribute schema for tokens, model, tenant, route, estimated_cost_usd.
- Metrics path: Prometheus (+ Thanos) for golden signals; Grafana for SLOs and FinOps boards.
- LLM path: Langfuse/LMNR for traces, scores, datasets, prompt versions.
- Control: Cap tokens, tool calls, and debug rounds; route models by step difficulty.
- Win: Measure cost-per-successful-task before you buy more GPUs or raise API quotas.
1. What “bottleneck” means for LLM agents
Training-time bottlenecks (data, FLOPs) differ from serving-time and agent-time bottlenecks. In production agents the dominant waste modes are:
- Prompt bloat — oversized system prompts, unreused context, missing prefix/cache hits.
- Model overkill — frontier models used for classify/route steps that a small model can do.
- Unbounded loops — tool retries and self-debug cycles without a hard budget (see Self-Debugging trade-offs in Turbocharging LLMs).
- External waits — vector DB, SaaS APIs, and human-in-the-loop gates mis-attributed to “LLM latency”.
- Serving fragmentation — KV cache waste on the GPU (PagedAttention/vLLM territory) after you have already confirmed the agent graph is sane.
Without distributed traces you cannot separate these. Observability is therefore not a nice-to-have dashboard — it is the control plane for FinOps and SRE on AI products.
2. Reference architecture
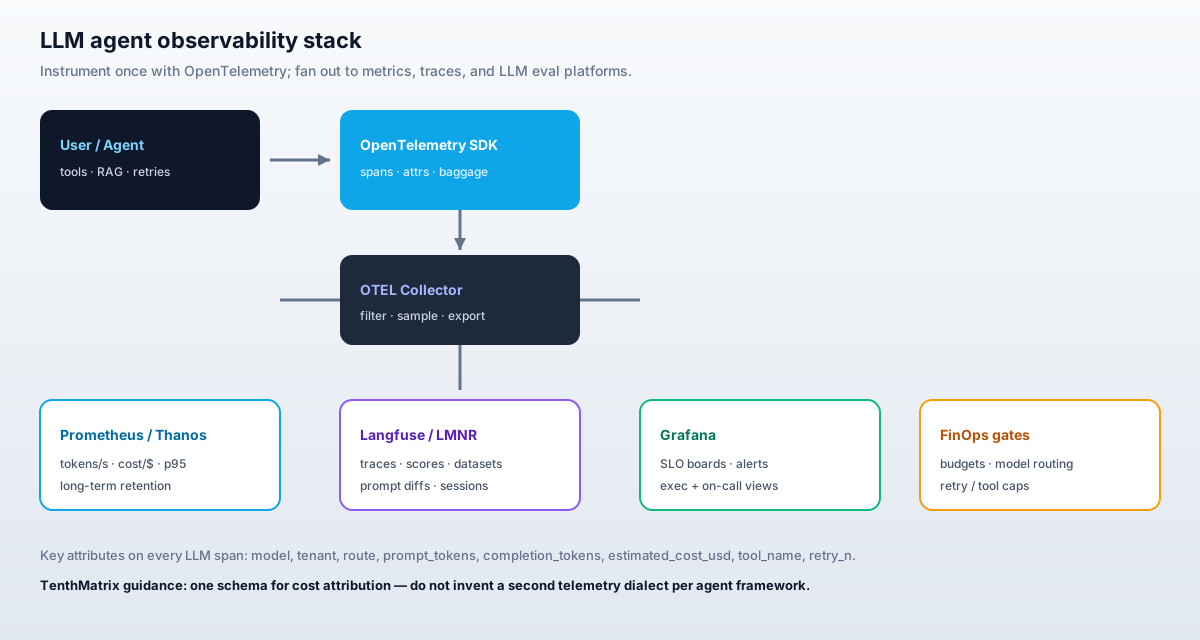
User / Orchestrator
    → Agent runtime (tools, RAG, LLM calls)
        → OpenTelemetry SDK (spans + metrics)
            → OTEL Collector (filter, sample, redact)
                ├─→ Prometheus / Thanos   (rates, costs, SLOs)
                ├─→ Grafana              (boards, alerts)
                └─→ Langfuse / LMNR      (traces, scores, datasets)
FinOps / policy layer reads the same metrics to enforce caps and model routing.
3. OpenTelemetry span schema for LLM calls
Adopt one convention across frameworks (LangChain, custom Go/Python agents, Bedrock SDKs). Prefer semantic conventions where they exist, and extend with stable TenthMatrix attributes:
| Attribute | Example | Why |
|---|---|---|
gen_ai.system | openai / anthropic / bedrock / vllm | Provider rollups |
gen_ai.request.model | claude-sonnet-4 / llama-3.1-8b | Cost & quality by model |
gen_ai.usage.input_tokens | 1820 | Prompt cost driver |
gen_ai.usage.output_tokens | 410 | Completion cost driver |
wsw.estimated_cost_usd | 0.0124 | FinOps without joining price sheets later |
wsw.tenant_id | acme-prod | Chargeback |
wsw.route | support.triage | Product feature attribution |
wsw.agent_step | plan / tool / critique | Find expensive steps |
wsw.retry_n | 2 | Loop detection |
wsw.prompt_version | triage@v17 | Regression linkage |
from opentelemetry import trace
from opentelemetry.trace import Status, StatusCode

tracer = trace.get_tracer("workstation.agents")

PRICE_IN = 0.003 / 1000   # example $/token — load from config
PRICE_OUT = 0.015 / 1000

def complete_llm(model: str, prompt: str, tenant: str, route: str):
    with tracer.start_as_current_span("gen_ai.chat") as span:
        span.set_attribute("gen_ai.system", "openai")
        span.set_attribute("gen_ai.request.model", model)
        span.set_attribute("wsw.tenant_id", tenant)
        span.set_attribute("wsw.route", route)
        try:
            resp = client.chat.completions.create(
                model=model,
                messages=[{"role": "user", "content": prompt}],
            )
            usage = resp.usage
            cost = usage.prompt_tokens * PRICE_IN + usage.completion_tokens * PRICE_OUT
            span.set_attribute("gen_ai.usage.input_tokens", usage.prompt_tokens)
            span.set_attribute("gen_ai.usage.output_tokens", usage.completion_tokens)
            span.set_attribute("wsw.estimated_cost_usd", round(cost, 6))
            return resp.choices[0].message.content
        except Exception as e:
            span.record_exception(e)
            span.set_status(Status(StatusCode.ERROR, str(e)))
            raise
Practice: compute estimated_cost_usd at the span. Do not wait for a nightly job to join token counts to price sheets — on-call and product owners need live FinOps.
3b. Multi-agent span hierarchy and baggage
Agent graphs need a stable parent/child model so cost rolls up correctly:
session (root)
  └─ agent.run {wsw.route, wsw.tenant_id}
       ├─ rag.retrieve {wsw.agent_step=retrieve}
       ├─ gen_ai.chat {wsw.agent_step=plan, model=…}
       ├─ tool.execute {tool=…, wsw.retry_n}
       ├─ gen_ai.chat {wsw.agent_step=synthesize}
       └─ eval.score {score.name, score.value}
- One root per user task — not per LLM call. Session cost = sum of child
wsw.estimated_cost_usd. - Baggage — propagate
wsw.tenant_idandwsw.routeacross async workers / queues so tool spans inherit chargeback labels without re-plumbing every call site. - Links — when a sub-agent starts a new trace (e.g. separate queue consumer), use span links back to the parent session so Langfuse/Grafana can still stitch the graph.
- Always-sample high cost — head sampling at 5–20% is fine for happy paths; force sample when session spend exceeds a threshold or status=ERROR.
4. Metrics that matter (Prometheus)
Export histograms and counters (via OTEL metrics or a Prometheus client). Minimum viable set:
llm_requests_total{model,route,status}llm_tokens_total{model,direction}where direction ∈ {input,output}llm_estimated_cost_usd_total{model,tenant,route}llm_ttft_seconds/llm_e2e_secondshistogramsagent_tool_calls_total{tool,status}agent_retries_total{route}agent_task_success_total{route}— denominator for cost-per-success
Derived FinOps queries (PromQL sketches):
# Cost per successful task (last 1h), by route
sum(rate(llm_estimated_cost_usd_total[1h])) by (route)
  /
sum(rate(agent_task_success_total[1h])) by (route)

# Retry tax
sum(rate(agent_retries_total[1h])) by (route)
  /
sum(rate(llm_requests_total[1h])) by (route)
Thanos (or Mimir/Cortex) matters when Finance asks for quarter-over-quarter model spend. Local Prometheus alone is fine for on-call; it is not a FinOps archive.
5. Grafana boards and alerts
Ship three audiences from one datasource:
- On-call: error rate, p95 e2e, dependency failures (vector DB / tools).
- Platform: tokens/s, GPU util (if self-hosted), queue depth, TTFT.
- FinOps / product: $/success by tenant and route, top expensive prompts, model mix.
Alert on burn, not vanity:
- Cost-per-success > budget SLO for 30m
- Retry rate > 15% for a route
- p95 e2e breach with rising input tokens (prompt regression)
6. LLM-native platforms: Langfuse, LMNR, and friends
Metrics tell you that cost spiked; LLM platforms tell you which prompt version and which tool span did it. Langfuse and LMNR are open-source examples of this class:
- Hierarchical traces (session → agent → LLM / tool spans)
- Human and LLM-as-judge scores
- Datasets for offline eval when you change prompts
- Optional usage telemetry for product improvement (respect privacy policies)
Integration pattern: keep OTEL as the system of record for SRE; dual-export or bridge into Langfuse for prompt engineering. Do not invent a second, incompatible attribute dictionary.
Framework experiments such as function-first agent runtimes (historically marketed around structured streaming agents) can reduce boilerplate, but treat niche frameworks as optional — observability standards outlive them.
7. Scoring pipeline: manual vs automatic
| Method | Implementation | Failure mode |
|---|---|---|
| Manual | Thumbs / rubrics in Langfuse UI; gold set reviews. | Does not scale; still required for calibration. |
| Automatic | LLM-as-judge, unit checks, schema validators, retrieval recall. | Judge drift; gaming if optimising only for the judge. |
Attach scores as span events or Langfuse scores keyed by wsw.prompt_version. Gate promotions of prompts the same way you gate app versions — Ring Promoter for code; eval gates for prompts.
8. Cost-saving process (detailed)
- Baseline week: no behaviour change; only instrumentation. Capture $/success, tokens/success, retry rate.
- Attribution: rank routes by spend × volume. Pick the top three.
- Model routing: split classify/extract to small/local models; keep frontier for synthesis. Re-measure quality scores.
- Prompt surgery: remove unused tool schemas; shorten few-shots; enable prefix cache where safe.
- Loop caps: max tool calls, max self-debug rounds, exponential backoff with circuit breakers.
- Sampling: keep 100% metrics; sample traces (e.g. 5–20%) plus always-on sampling for errors and high-cost sessions.
- Redaction: strip PII from span attributes before export; store full prompts only in approved stores with TTL.
- Review cadence: weekly FinOps board; monthly judge calibration against humans.
8b. Managing agent usage with live budgets
Dashboards alone do not stop runaway agents. Enforce budgets in the runtime, emit the decision as a span event, and alert when sessions hit the ceiling often:
# Pseudocode: hard budget around an agent session
class Budget:
    def __init__(self, max_usd=0.50, max_tool_calls=8, max_llm_calls=12):
        self.max_usd, self.max_tool_calls, self.max_llm_calls = max_usd, max_tool_calls, max_llm_calls
        self.spent = 0.0
        self.tools = self.llms = 0

    def charge(self, usd: float, kind: str):
        self.spent += usd
        if kind == "tool":
            self.tools += 1
        else:
            self.llms += 1
        if self.spent > self.max_usd or self.tools > self.max_tool_calls or self.llms > self.max_llm_calls:
            raise RuntimeError("agent budget exhausted")
- Per-session caps — USD, LLM calls, tool calls (above).
- Per-tenant daily quotas — Redis/counter keyed by
wsw.tenant_id; return a controlled degraded path when exhausted. - Per-route model policy — allowlist models for
support.triagevslegal.draft; reject or downshift on policy miss and recordwsw.policy_action=downshift. - Idempotent tool keys — hash tool args so retries do not double-bill external APIs.
- Cost formula —
cost = in_tokens × p_in + out_tokens × p_out + tool_fees; refreshp_in/p_outfrom a versioned price sheet so historical Thanos data stays comparable.
Metric to watch after caps land: agent_budget_exhausted_total{route,reason}. A spike means either abuse, a broken tool loop, or a budget that is too tight for real workloads.
9. Collector configuration sketch
# otel-collector-config.yaml (illustrative)
receivers:
  otlp:
    protocols:
      http:
      grpc:
processors:
  memory_limiter: {}
  batch: {}
  attributes/redact:
    actions:
      - key: gen_ai.prompt
        action: delete
exporters:
  prometheus:
    endpoint: "0.0.0.0:8889"
  otlp/langfuse:
    endpoint: "${LANGFUSE_OTLP_ENDPOINT}"
    headers:
      Authorization: "Bearer ${LANGFUSE_KEY}"
service:
  pipelines:
    traces:
      receivers: [otlp]
      processors: [memory_limiter, attributes/redact, batch]
      exporters: [otlp/langfuse]
    metrics:
      receivers: [otlp]
      processors: [memory_limiter, batch]
      exporters: [prometheus]
10. Pros, cons, and when not to bother
Pros: chargeback, faster incident triage, measurable ROI on prompt/model changes, compliance-friendly audit trails, shared language between ML and platform teams.
Cons: instrumentation debt; storage cost if you keep every prompt forever; risk of shipping PII into the wrong backend; another console for engineers to learn.
Skip (for now) if: you have a single offline batch job with fixed daily spend and no interactive agents. Still log tokens; skip the full multi-backend stack until concurrency appears.
11. Migration checklist
- ☐ OTEL SDK in the agent runtime; collector in the cluster
- ☐ Span attributes include model, tokens, cost, tenant, route
- ☐ Prometheus metrics + Grafana FinOps board
- ☐ Langfuse (or LMNR) wired for at least one critical path
- ☐ Hard caps on tokens / tools / retries
- ☐ Redaction policy reviewed by security
- ☐ Weekly review of $/success for top routes
- ☐ Document ADR linking observability → serving (vLLM) → promotion (Ring Promoter)
12. Related TenthMatrix material
- Business blog companion
- Turbocharging LLMs — fix serving after you can see the bottleneck
- Ring Promoter — promote agent services with health gates
- Muse Glimmer / local agents
- Contact TenthMatrix for Enterprise AI Lab engagements
References
Published by TenthMatrix.